Debugging Tools
Twilio offers several tools for investigating the interaction between Twilio and your application. If a message cannot go through, is delayed, or otherwise behaves unexpectedly, these tools should be your first stops for debugging.
Found in your Twilio console, Error Logs contains a detailed log of activity within your application. This log can help you dive deeper and understand which Twilio resources were affected (and by whom).
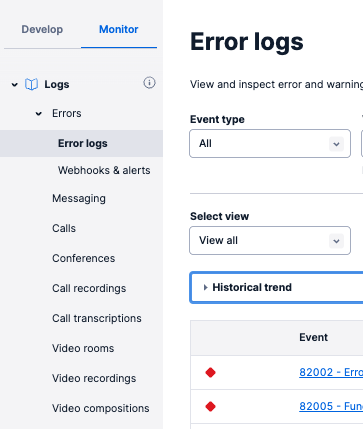
A. To get to the Error Logs, open the Console navigation and go to Monitor > Logs > Error Logs:
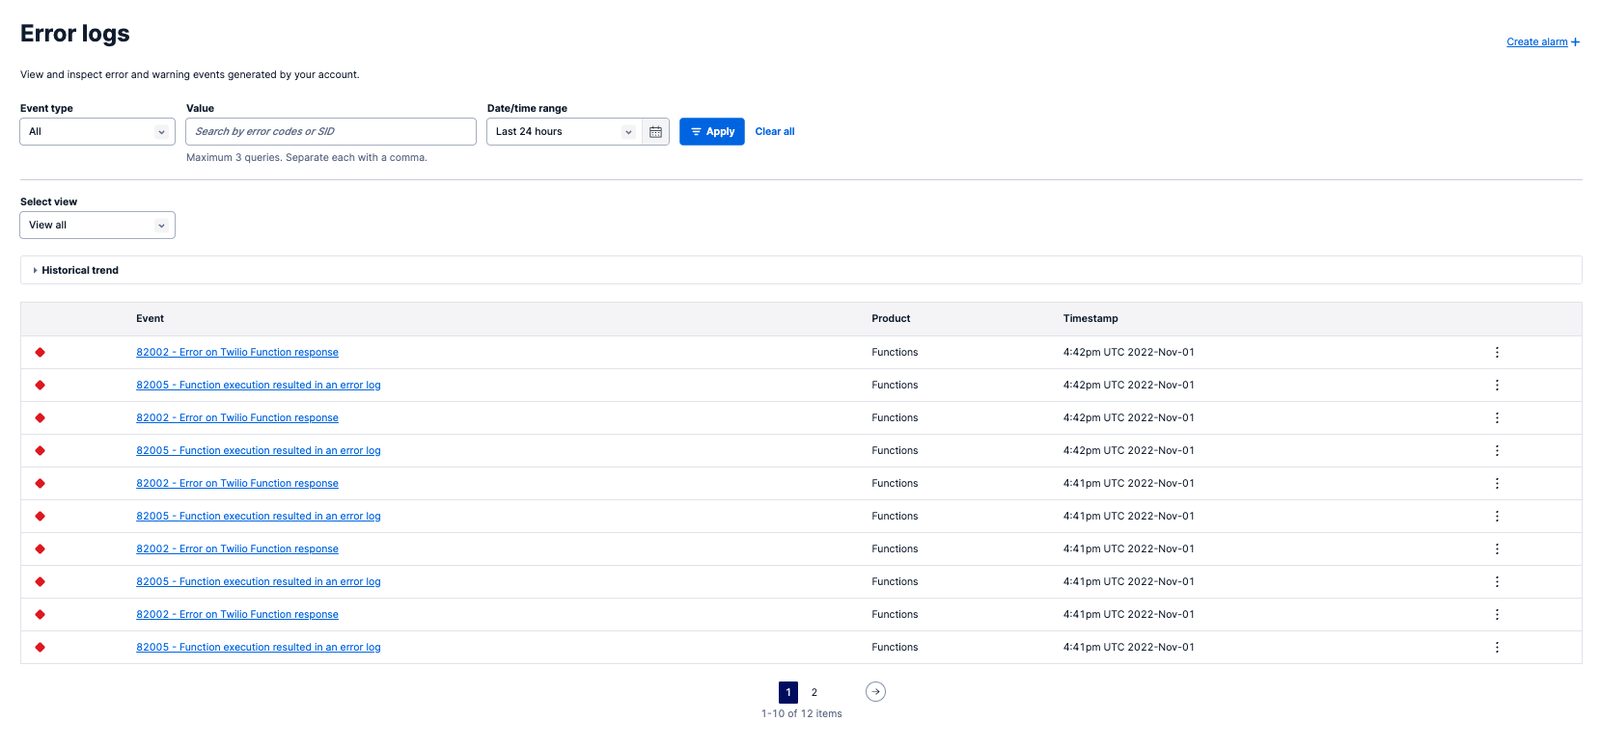
B. Once on the Error Logs screen, you can dig into detailed logs. You can see which product was impacted by an error or warning by the value in the 'Product' column.
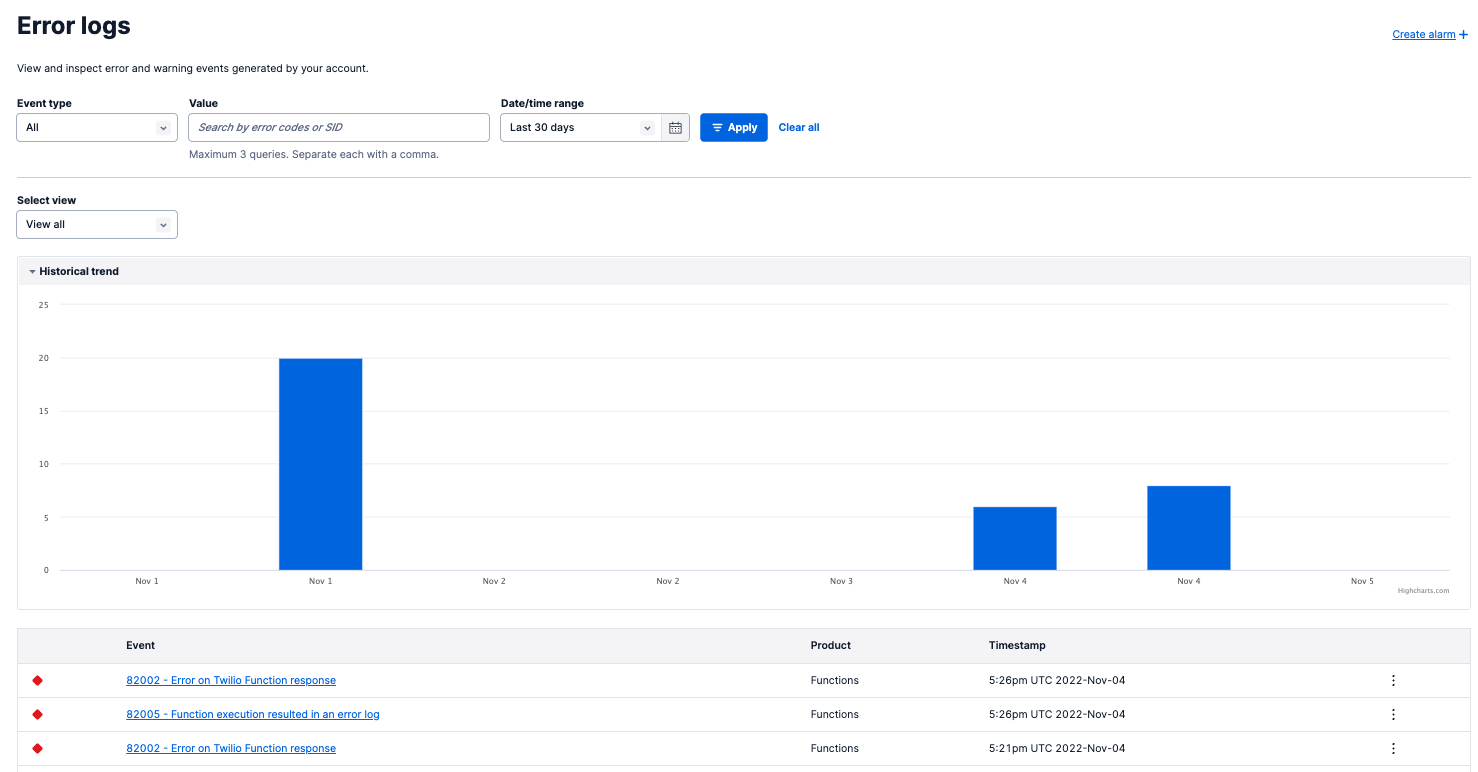
C. You can also view a histogram of events for a given date/time range by clicking Historical trend element above the list of events, for example:
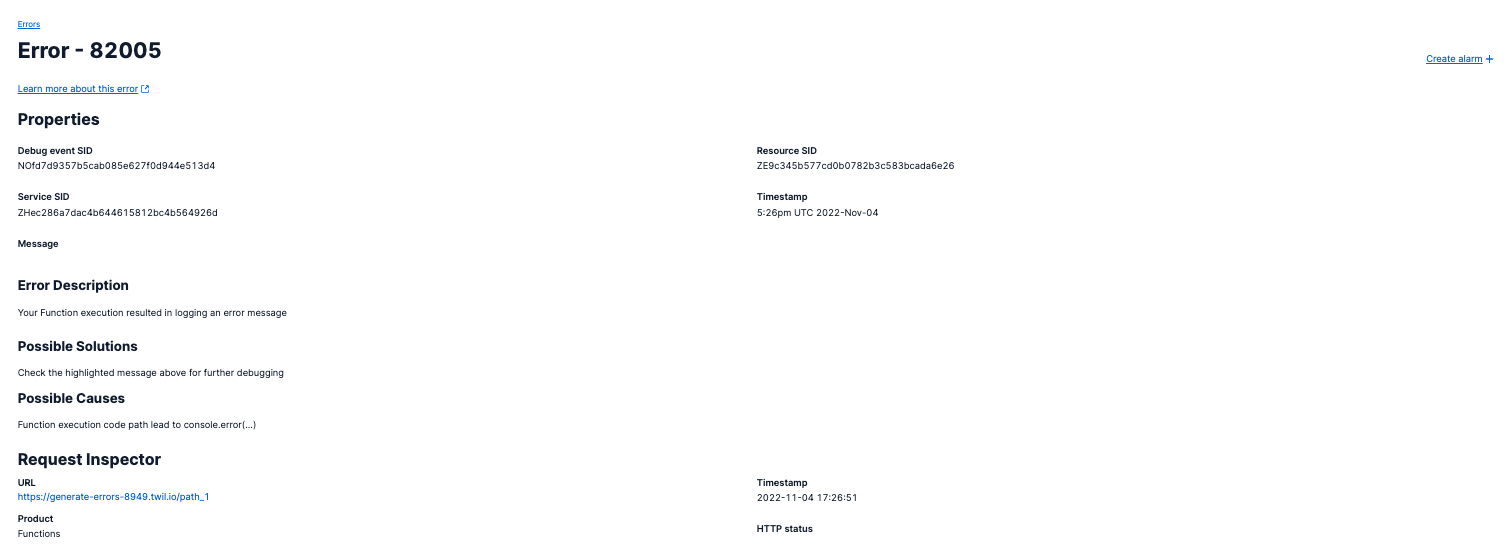
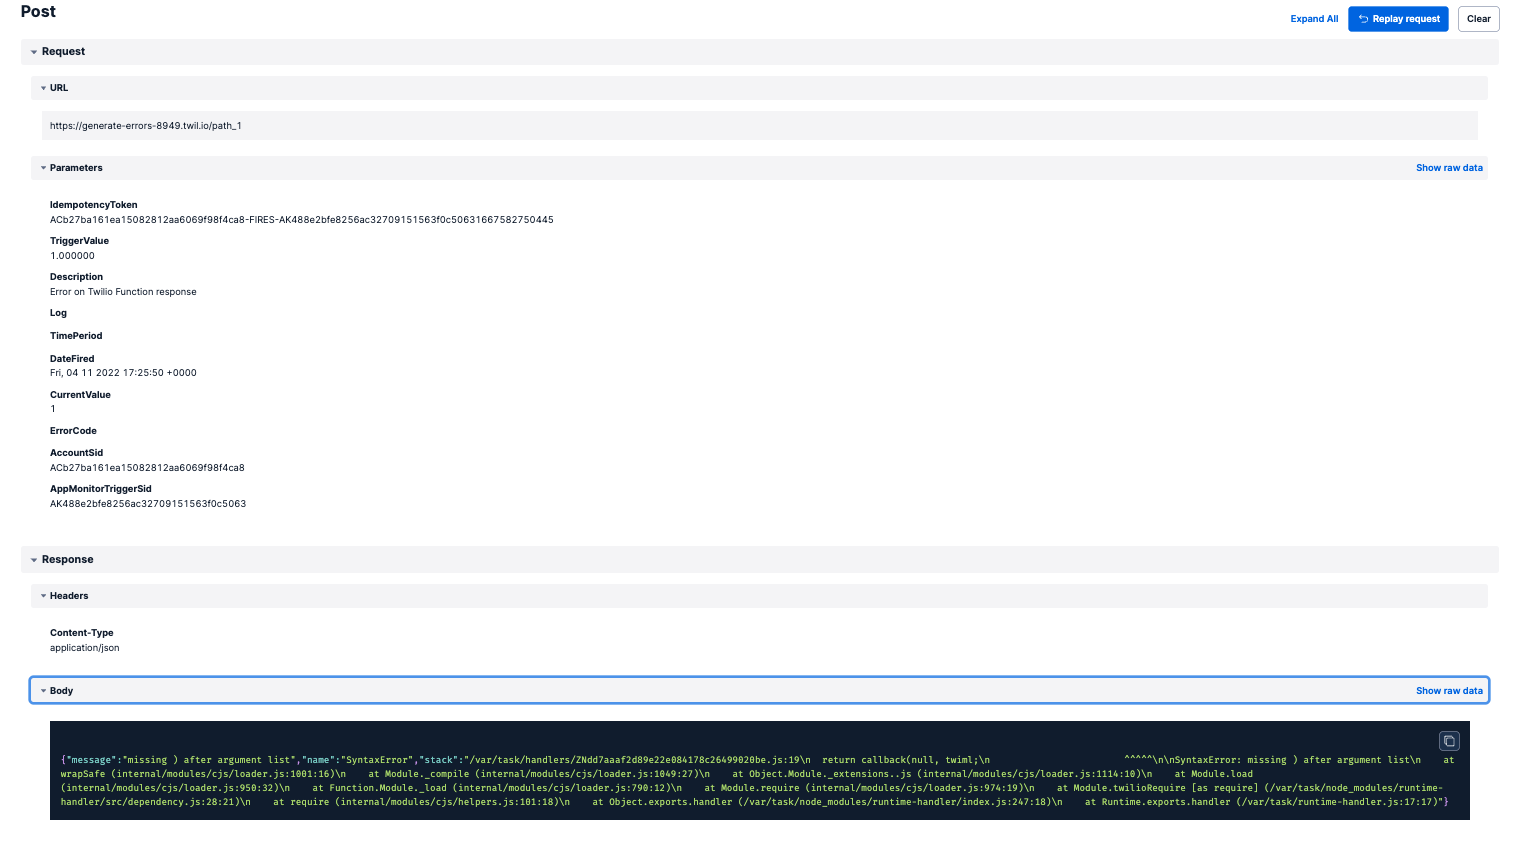
D. By clicking on an event in the in Error Logs, you can see properties of the message that encountered an error. These include timestamps, your resource SID, any warnings or errors thrown by Twilio, and the full context of the message request and response.
Alarms allow you to create customized alerts based on spikes in certain types of errors and proactively monitor your application. This feature replaces the previous concept of Alert Triggers.
If you encounter issues with message delivery, such as duplicate message delivery, the best way to begin debugging is by viewing your Message logs.
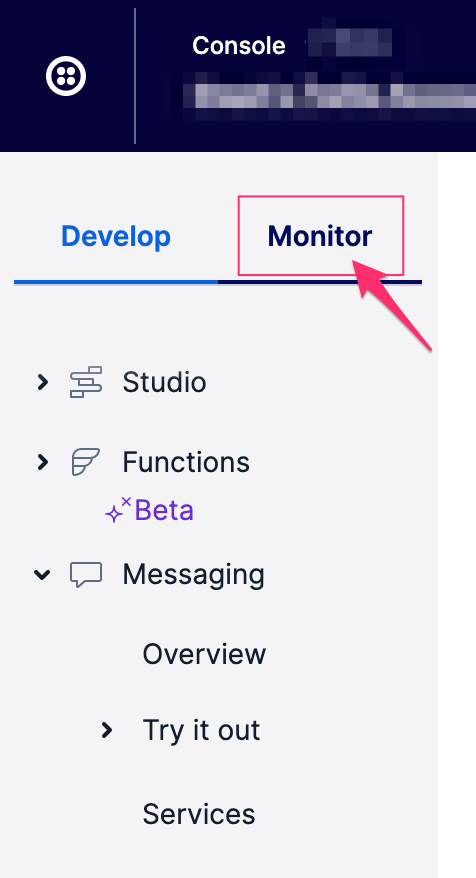
A. Log into your Twilio account and click Monitor in the navigation menu.
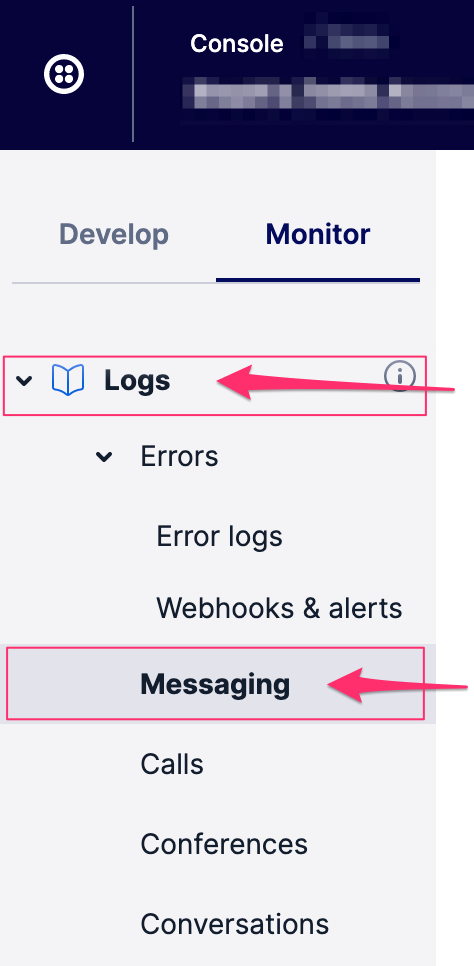
B. Then, click Logs to expand the Log menu. Click Messaging afterward:
C. Once you're in your Messaging logs, find the message where the problem occurred. Click the hyperlinked date to dig down into the details for this message. You'll see messages that hit something other than a 200 are highlighted in yellow or red.
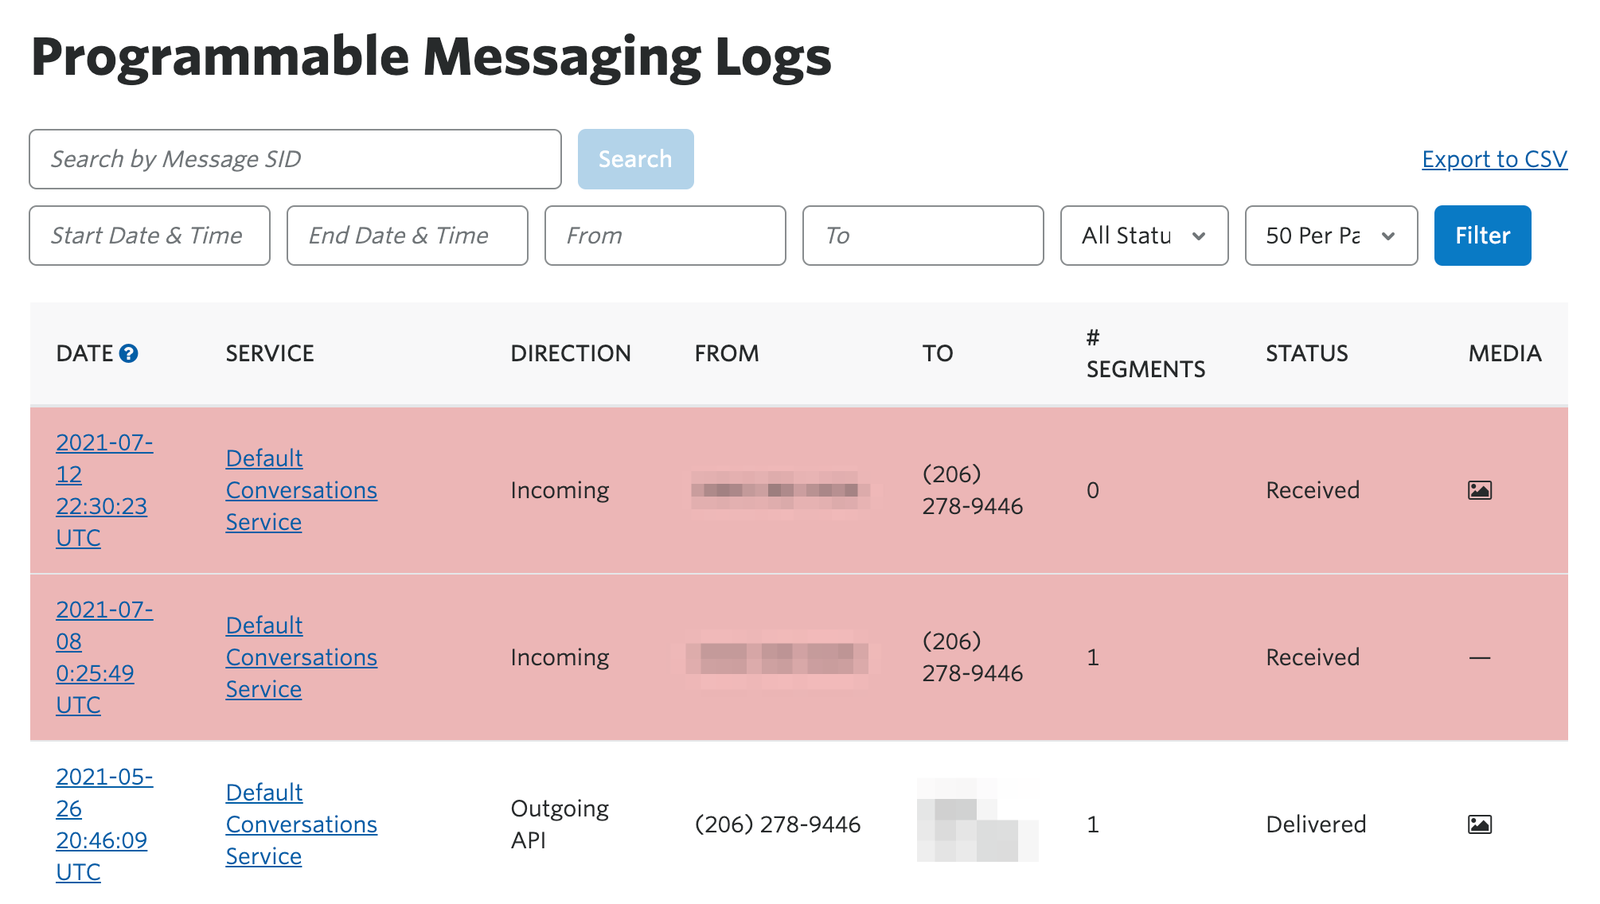
As you can see above, each log line includes the number of message segments, the message status, TO and FROM numbers, as well as if any media was attached.
D. To dig deeper into a log for a given message, click on the hyperlinked date. This will take you to the Message Details:
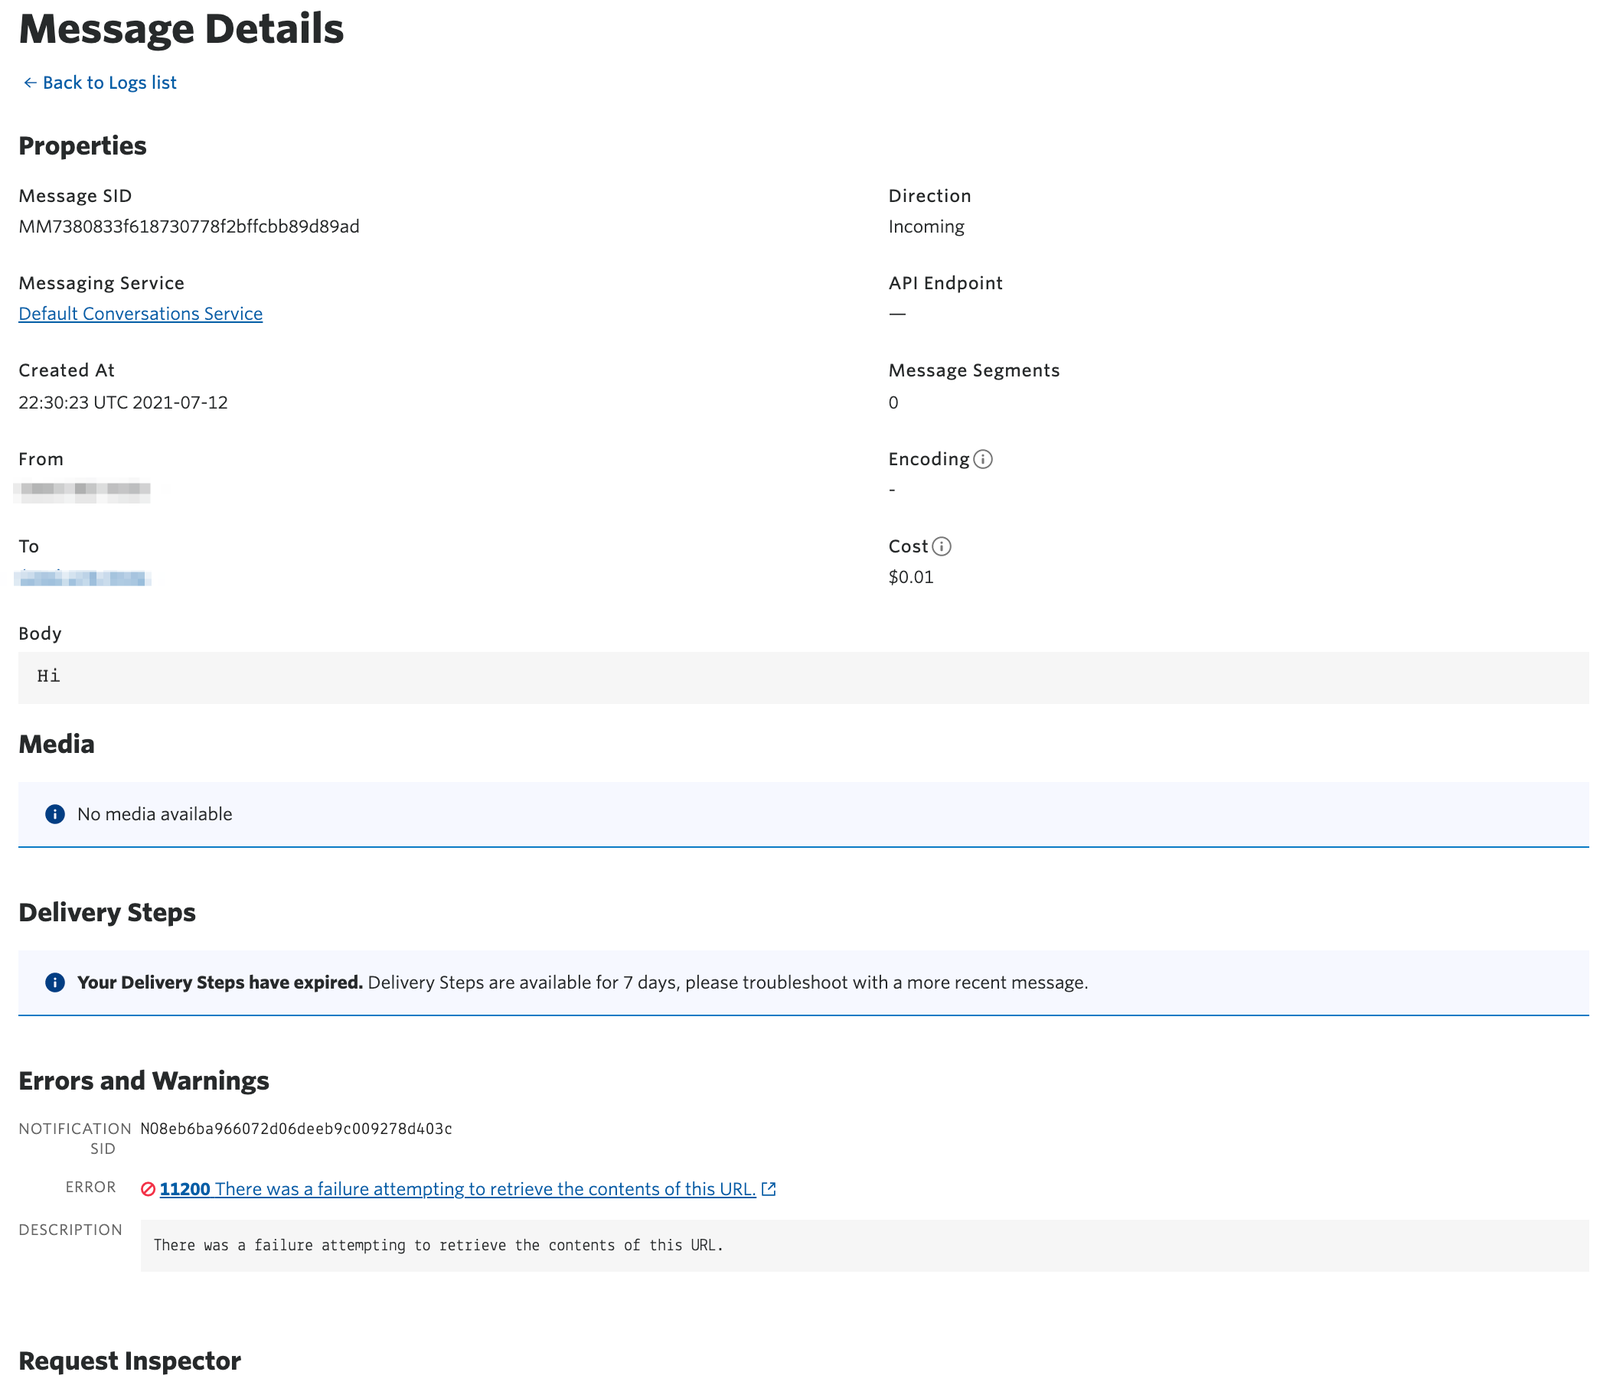
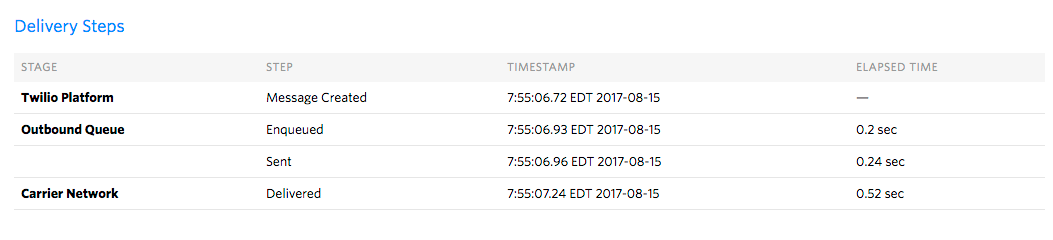
In the detailed view of the message log, you can find the Message SID (Twilio's unique identifier for this message), as well as the time the resource was created, TO and FROM numbers, Delivery Steps, and the Request Inspector.
The Delivery Steps section of this log will show you when the request was created, how long it was queued on Twilio's platform, and when it was sent out to our carrier partner for delivery. These factors can help you determine where an undelivered message failed, or investigate latency issues.
The request inspector shows all requests and responses made when sending or receiving this message. You can easily see errors on requests by the color-coded status on the right of a request.
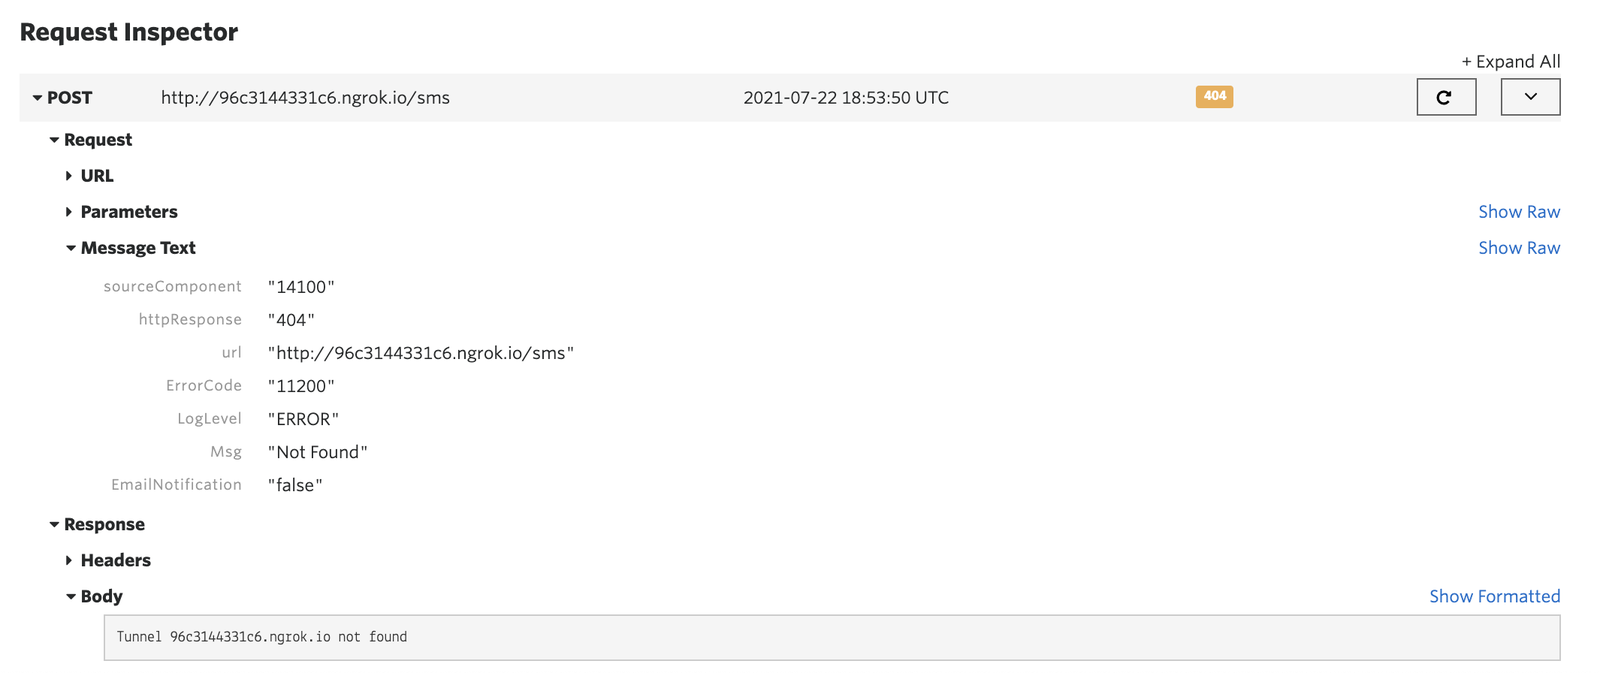
In the above response, we can see that we received a 404 response because Twilio was unable to find the tunnel for the webhook we set up for messages.
All Twilio-generated error codes are documented in this Errors catalog. Find your error code via your SMS logs and dig into causes and possible solutions.
Common Programmable Messaging error codes are listed in the table below. These error codes show up in the ErrorCode properties of Twilio's status callback requests and in the Message resource's ErrorCode property.
| Error Code | Error Message | Description |
|---|---|---|
| 30001 | Queue overflow | You tried to send too many messages too quickly, and your message queue overflowed. Try sending your message again after waiting for some time. |
| 30002 | Account suspended | Your account was suspended between the time of message send and delivery. Please contact Twilio. |
| 30003 | Unreachable destination handset | The destination handset you are trying to reach is switched off or otherwise unavailable. |
| 30004 | Message blocked | The destination number you are trying to reach is blocked from receiving this message (e.g., due to blacklisting). |
| 30005 | Unknown destination handset | The destination number you are trying to reach is unknown and may no longer exist. |
| 30006 | Landline or unreachable carrier | The destination number is unable to receive this message. Potential reasons could include trying to reach a landline or, in the case of short codes, an unreachable carrier. |
| 30007 | Carrier violation | Your message was flagged as objectionable by the carrier. To protect their subscribers, many carriers have implemented content or spam filtering. Learn more about carrier filtering |
| 30008 | Unknown error | The error does not fit into any of the above categories. |
| 30009 | Missing segment | One or more segments associated with your multi-part inbound message was not received. |
| 30010 | Message price exceeds max price. | The price of your message exceeds the max price parameter. |
The following ErrorCodes apply only when you are sending a message via WhatsApp or another non-SMS messaging channel.
| Error Code | Error Message | Description |
|---|---|---|
| 63001 | Channel could not authenticate the request | Channel authentication credentials are incorrect. Please check the credentials in Channel page in Console or re-authenticate with the Channel. |
| 63002 | Channel could not find From address | The From address does not map to any configured Channels. Check that you are using the correct Channel endpoint address from the Channel page. |
| 63003 | Channel could not find To address | The To address is incorrect. |
| 63005 | Channel did not accept given content | |
| 63006 | Could not format given content for the channel | |
| 63007 | Twilio could not find a Channel with the specified From address | The From address does not map to any configured Channels. Check that you are using the correct Channel endpoint address from the Channel page. |
| 63008 | Could not execute the request because the channel module is misconfigured | Please check the Channel configuration in Twilio. |
| 63009 | Channel returned an error when executing the request | Please see Channel specific error message for more information. |
| 63010 | Channels - Twilio Internal error | |
| 63012 | Channel returned an internal error that prevented it from completing the request | |
| 63013 | This message send failed because it violates Channel provider's policy. | Please see Channel specific error message for more information. |
| 63014 | This message failed to be delivered to the user because it was blocked by a user action. | Please see Channel specific error message for more information. |
Each message that Twilio sends is matched to a record in these logs and identified by a 34-character string starting with 'SM' for SMS or 'MM' for MMS. This is your Message SID. If you are unable to figure out what went wrong with your message, you can contact our stellar support team by filling out this form, including any message SIDs affected.